Data recorded during a flight from Adelaide to Melbourne
Using a Raspberry Pi and Pi-Hat during a flight from Adelaide to Melbourne the following parameters were recoded: temperature, pressure, humidity, magnetic field, acceleration and orientations.
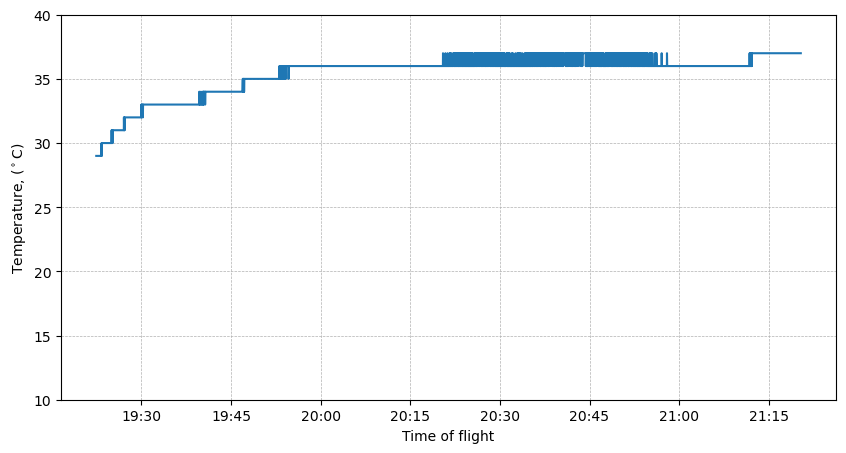
- Temperature variation during the flight.
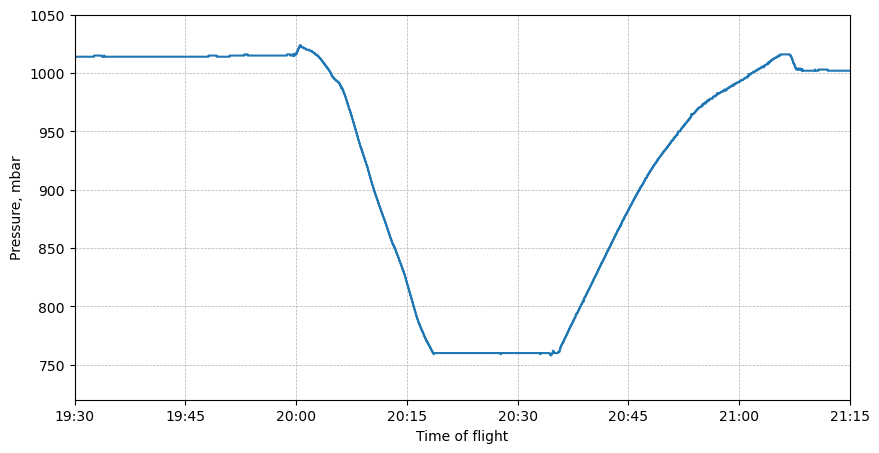
- Pressure variation during the flight.
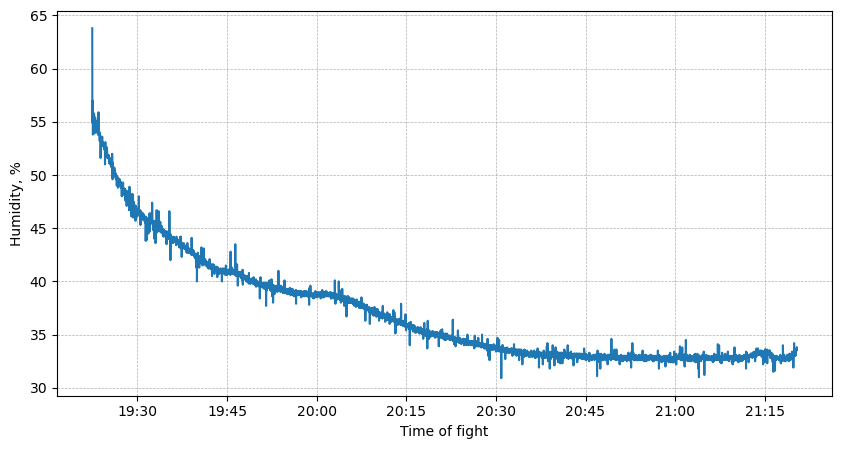
- Humidity variation during the flight
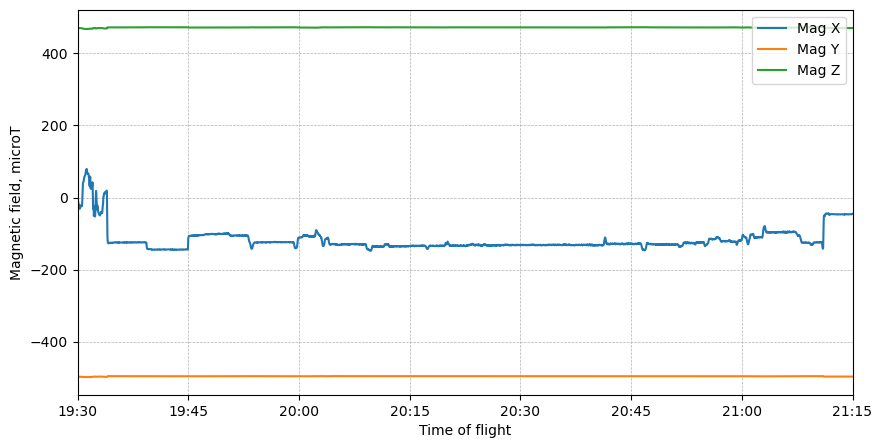
- Magnetic field variation
- Acceleration X, Y, Z
- Orientation: pitch, roll and yaw
- The code loaded into the Raspberry Pi
Temperature variation during the flight.
The plot bellow shows the temperature variation:
 The plot was generated using the following code:
# Load the Pandas libraries with alias 'pd'
import pandas as pd
from datetime import datetime
import matplotlib.pyplot as plt


data = pd.read_csv("data_adl2mel.csv", index_col=False, parse_dates=["datetime"])
df = pd.DataFrame(data)

# Set the datetime column as the index
df.set_index('datetime', inplace=True)


#Plot temperature
plt.figure(figsize=(10,5))
plt.plot(df.index, df['temp'], label='Temperature')
plt.xlabel('Time of flight')
plt.ylabel('Temperature, ($^\circ$C)')
ax = plt.gca()  # Get the current Axes instance on the current figure
date_format = plt.matplotlib.dates.DateFormatter('%H:%M')  # Set format to hour:minute
ax.xaxis.set_major_formatter(date_format)
ax.grid(axis='both', linestyle='--', linewidth=0.5)
plt.ylim(10,40)
plt.show()
Pressure variation during the flight.
The plot bellow shows the pressure inside the cabin during the flight:
Here is the code:
#Plot pressure
plt.figure(figsize=(10,5))
plt.plot(df.index, df['pres'], label='Pressure')
plt.xlabel('Time of flight')
plt.ylabel('Pressure, mbar')

ax = plt.gca()  # Get the current Axes instance on the current figure
date_format = plt.matplotlib.dates.DateFormatter('%H:%M')  # Set format to hour:minute
ax.xaxis.set_major_formatter(date_format)

# Set x-axis limits to 2023-10-01 19:30 and 2023-10-01 21:15
start_datetime = pd.to_datetime('2022-11-09 19:30', format='%Y-%m-%d %H:%M')
end_datetime = pd.to_datetime('2022-11-09 21:15', format='%Y-%m-%d %H:%M')

ax.set_xlim(start_datetime, end_datetime)
plt.ylim(720,1050)

ax.grid(axis='both', linestyle='--', linewidth=0.5)
plt.show()
Humidity variation during the flight
Here is the plot:
It was generate with the following code:
#Plot Humidity
plt.figure(figsize=(10,5))
plt.plot(df.index, df['hum'], label='Humidity')
plt.xlabel('Time of fight')
plt.ylabel('Humidity, %')

ax = plt.gca()  # Get the current Axes instance on the current figure
date_format = plt.matplotlib.dates.DateFormatter('%H:%M')  # Set format to hour:minute
ax.xaxis.set_major_formatter(date_format)
# plt.xlim(1000,6500)
# plt.ylim(720,1100)

ax.grid(axis='both', linestyle='--', linewidth=0.5)
plt.show()
Magnetic field variation
Here is the plot:
Same trend to plot it:
#Plot magnometer X, Y,Z
plt.figure(figsize=(10,5))
plt.plot(df.index, df['mag_x'], label='Mag X')
plt.plot(df.index, df['mag_y'], label='Mag Y')
plt.plot(df.index, df['mag_z'], label='Mag Z')
plt.xlabel('Time of flight')
plt.ylabel('Magnetic field, microT')
plt.legend(loc='upper right')

# plt.xlim(1000,6500)
# plt.ylim(720,1100)

ax = plt.gca()  # Get the current Axes instance on the current figure
date_format = plt.matplotlib.dates.DateFormatter('%H:%M')  # Set format to hour:minute
ax.xaxis.set_major_formatter(date_format)

# Set x-axis limits to 2023-10-01 19:30 and 2023-10-01 21:15
start_datetime = pd.to_datetime('2022-11-09 19:30', format='%Y-%m-%d %H:%M')
end_datetime = pd.to_datetime('2022-11-09 21:15', format='%Y-%m-%d %H:%M')

ax.set_xlim(start_datetime, end_datetime)
ax.grid(axis='both', linestyle='--', linewidth=0.5)
plt.show()
Acceleration X, Y, Z
Acceleration variation is all over the place during take of and landing:
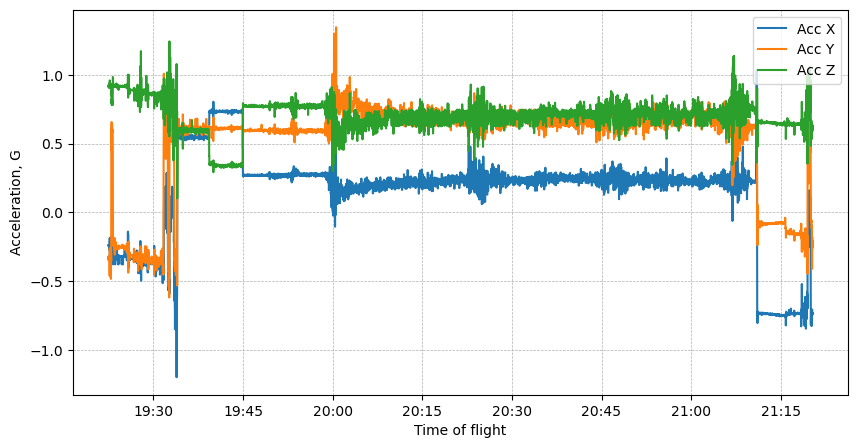
Similarly:
#Plot Acceleration X, Y,Z
plt.figure(figsize=(10,5))
plt.plot(df.index, df['acc_x'], label='Acc X')
plt.plot(df.index, df['acc_y'], label='Acc Y')
plt.plot(df.index, df['acc_z'], label='Acc Z')
plt.xlabel('Time of flight')
plt.ylabel('Acceleration, G')
plt.legend(loc='upper right')
# plt.xlim(1000,6500)
# plt.ylim(720,1100)
ax = plt.gca()  # Get the current Axes instance on the current figure
date_format = plt.matplotlib.dates.DateFormatter('%H:%M')  # Set format to hour:minute
ax.xaxis.set_major_formatter(date_format)
ax.grid(axis='both', linestyle='--', linewidth=0.5)
plt.show()
Orientation: pitch, roll and yaw
This is also interesting:
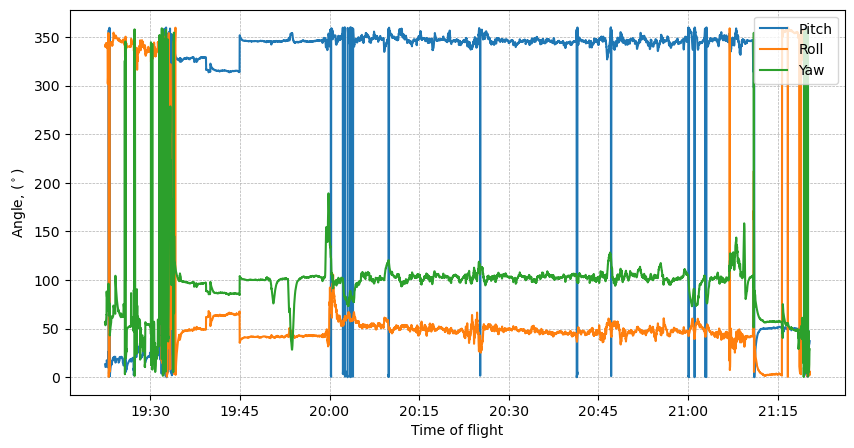
Yaw - left / right pedal corrections quite a lot at the beginning of the flight.
Roll - up / down - quite smooth
Pitch - left / right yoke - quite drastic.
Here is the code:
#Plot Orientation X, Y,Z
plt.figure(figsize=(10,5))
plt.plot(df.index, df['pitch'], label='Pitch')
plt.plot(df.index, df['roll'], label='Roll')
plt.plot(df.index, df['yaw'], label='Yaw')
plt.xlabel('Time of flight')
plt.ylabel('Angle, ($^\circ$)')
plt.legend(loc='upper right')
# plt.xlim(1000,6500)
# plt.ylim(720,1100)

ax = plt.gca()  # Get the current Axes instance on the current figure
date_format = plt.matplotlib.dates.DateFormatter('%H:%M')  # Set format to hour:minute
ax.xaxis.set_major_formatter(date_format)
ax.grid(axis='both', linestyle='--', linewidth=0.5)
plt.show()
The code loaded into the Raspberry Pi
Here is the code. I used joystick movement to start recoding once I was inside the airplane with Raspberry Pi seating in the overhead locker.
from sense_hat import SenseHat, ACTION_PRESSED, ACTION_HELD, ACTION_RELEASED
from datetime import datetime
import csv
import time
import sys

sense = SenseHat()
sense.set_imu_config(True, True, True)  # accelerometer, magnetometer , gyroscope
sense.clear()

logging = "standby"

def get_sense_data():
  sense_data = []
  temperature = round(sense.get_temperature(),0)
  pressure = round(sense.get_pressure(),0)
  humidity = round(sense.get_humidity(),1)
  sense_data.append(temperature)
  sense_data.append(pressure)
  sense_data.append(humidity)

  mag = sense.get_compass_raw()
  mag_x = round(mag["x"],2)
  mag_y = round(mag["y"],2)
  mag_z = round(mag["z"],2)
  sense_data.append(mag_x)
  sense_data.append(mag_y)
  sense_data.append(mag_z)

  acc = sense.get_accelerometer_raw()
  acc_x = round(acc["x"],3)
  acc_y = round(acc["y"],3)
  acc_z = round(acc["z"],3)
  sense_data.append(acc_x)
  sense_data.append(acc_y)
  sense_data.append(acc_z)

  gyro = sense.get_orientation()
  pitch = round(gyro["pitch"],2)
  roll = round(gyro["roll"],2)
  yaw = round(gyro["yaw"],2)
  sense_data.append(pitch)
  sense_data.append(roll)
  sense_data.append(yaw)

  sense_data.append(datetime.now())

  return sense_data

def pushed_up(event):
  global logging#, timestart
  if event.action == ACTION_PRESSED:
    #print("START")
    sense.clear()
    sense.show_letter("R",[255,0,0])
    logging = "start"

def pushed_down(event):
  global logging
  if event.action != ACTION_PRESSED:
    #print("STOP")
    sense.clear()
    sense.show_letter("W",[0,255,0])
    logging = "standby"

def pushed_left(event):
  global logging
  if event.action != ACTION_PRESSED:
    #print("STOP")
    sense.clear()
    sense.show_letter("B",[0,0,255])
    sense.clear()
    logging = "stop"

sense.stick.direction_up = pushed_up
sense.stick.direction_down = pushed_down
sense.stick.direction_left = pushed_left

#timestamp = datetime.now()
#timestart = datetime.now()
#delay = 1000 #milliseconds


with open('data.csv', 'a') as my_data:
    #data_writer = writer(f)
    writer = csv.writer(my_data)
    #header = ['temp','pres','hum',
     #         'mag_x','mag_y','mag_z',
     #         'acc_x','acc_y','acc_z',
     #         'pitch','roll','yaw',
     #         'datetime']
    #writer.writerow(header)

    while True:
        if logging == "start":
            data = (get_sense_data())
      #dt = data[-1] - timestamp
      #elapsed = data[-1] - timestart
      #if int(dt.total_seconds()*1000) > delay:
        #print(round(elapsed.total_seconds()*1000))
        #data.append(round(elapsed.total_seconds()*1000))
            writer.writerow(data)
            #print(data)
            #sense.clear()
            #sense.show_letter("R",[255,0,0])
            time.sleep(1)
        elif logging == "standby":
            sense.show_letter("W",[0,255,0])
        elif logging == "stop":
            #sense.clear()
            #sense.show_letter("B",[0,0,255])
            sense.clear()
            time.sleep(1)
            break


#timestamp = datetime.now()