Plot monthly temperature
To clean the plot we compute monthly average: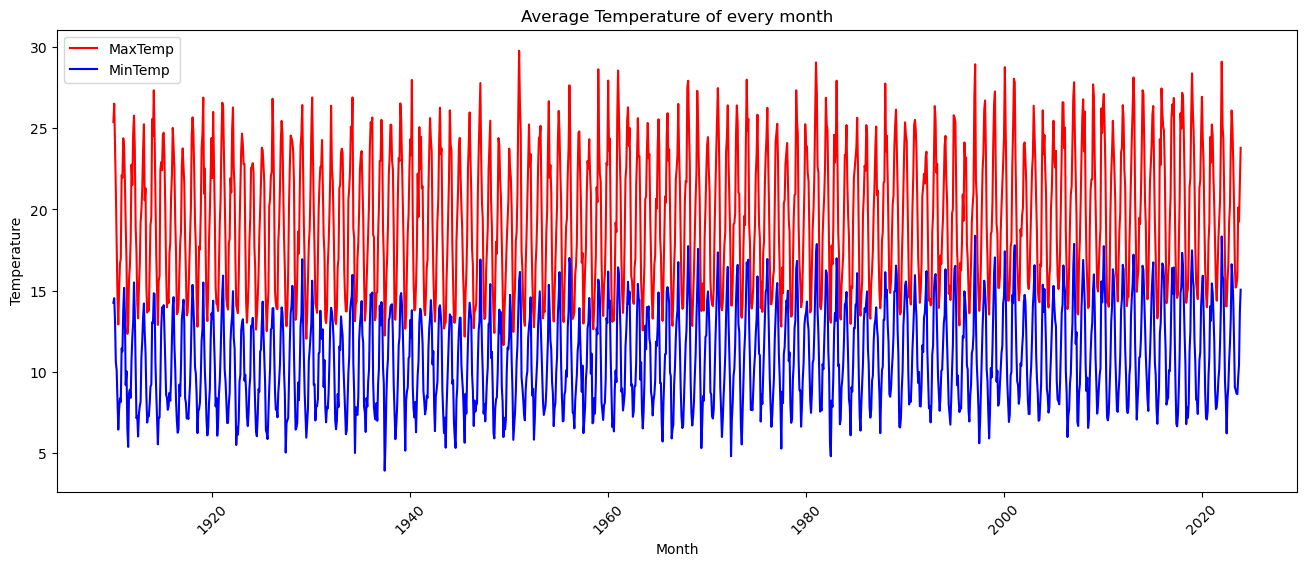
Generated by this code:
import matplotlib.pyplot as plt
import pandas as pd

df_max = pd.read_csv('tmax.csv')
df_min = pd.read_csv('tmin.csv')

# Assuming df_max and df_min are your DataFrames
df_max = df_max.reset_index()
df_min = df_min.reset_index()

# Convert 'Date' column to datetime
df_max['Date'] = pd.to_datetime(df_max['Date'], dayfirst=True)
df_min['Date'] = pd.to_datetime(df_min['Date'], dayfirst=True)

# Calculate average temperature of every month
df_max_month_avg = df_max.groupby(df_max['Date'].dt.to_period('M'))['t_max'].mean().reset_index()
df_min_month_avg = df_min.groupby(df_min['Date'].dt.to_period('M'))['t_min'].mean().reset_index()

# Rename columns
df_max_month_avg.columns = ['Month', 'Average Max Temperature']
df_min_month_avg.columns = ['Month', 'Average Min Temperature']

#Convert the 'Month' column to datetime objects:
df_max_month_avg['Month'] = df_max_month_avg['Month'].dt.to_timestamp()
df_min_month_avg['Month'] = df_min_month_avg['Month'].dt.to_timestamp()


# Plotting
plt.figure(figsize=(16,6))
plt.plot(df_max_month_avg['Month'], df_max_month_avg['Average Max Temperature'], color='red', label='MaxTemp')
plt.plot(df_min_month_avg['Month'], df_min_month_avg['Average Min Temperature'], color='blue', label='MinTemp')
plt.legend()
plt.xlabel('Month')
plt.ylabel('Temperature')
plt.title('Average Temperature of every month')
plt.xticks(rotation=45)
plt.show()
No comments to display
No comments to display